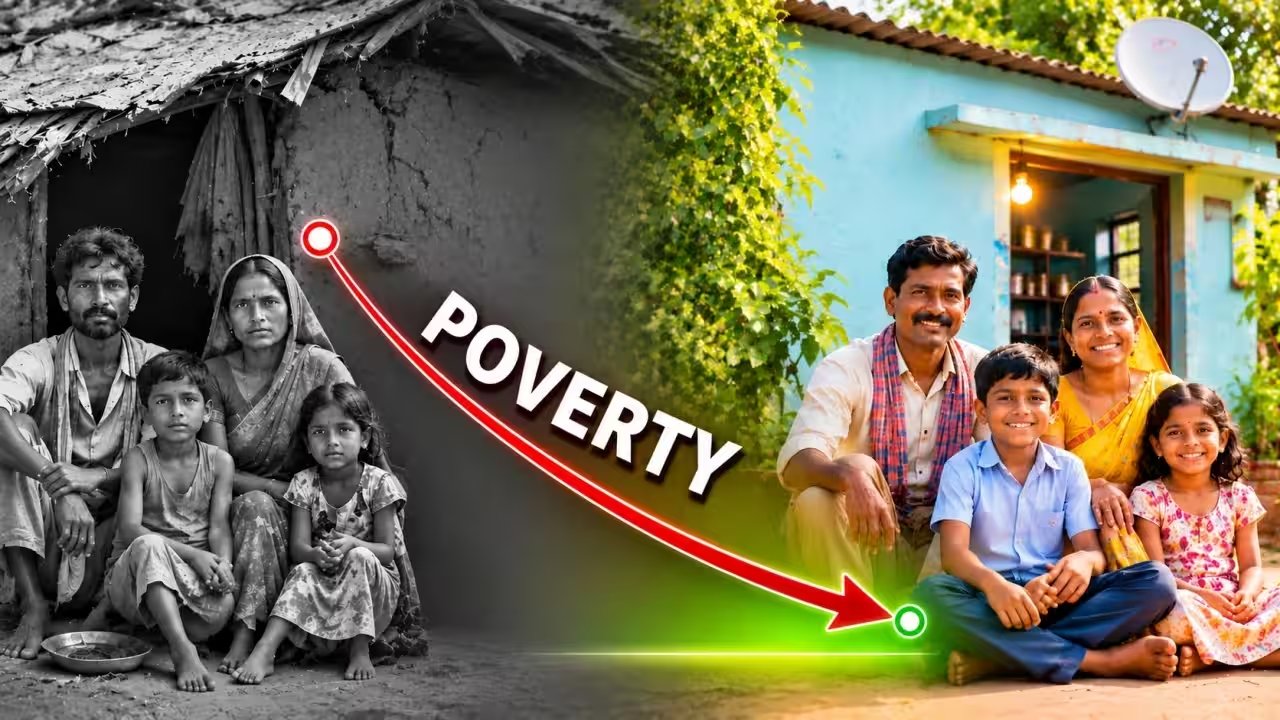
India pushed its extreme poverty rate down from 27.1% in 2011 to 2.6% in 2023, effectively clearing the internationally accepted threshold for the eradication of extreme deprivation.
The drop was historic.
According to the latest World Bank assessment, the country engineered one of the fastest poverty reductions recorded globally across both cash income and living standards. The multilateral institution defines international extreme poverty at $3.00 per person per day under 2021 purchasing power parity (PPP) terms. The benchmark established by the World Poverty Clock considers extreme deprivation eliminated once a country's poverty headcount ratio sinks beneath 3%. With the World Bank estimating India's extreme poverty rate at approximately 2% in 2024, the nation has crossed that line.
Yet the broader economic picture reveals sharp internal fractures.
Progress extended far beyond the bare subsistence line. Over the same 12-year window between 2011 and 2023, the share of Indians living below the Lower Middle-Income Country threshold of $4.20 a day plummeted from 57.7% to 16.1%. That contraction pulled 496 million people out of poverty.
Non-monetary measures recorded parallel gains. The Multidimensional Poverty Index (MPI) published by the Oxford Poverty and Human Development Initiative plunged from 53.8% in 2005-06 to 16.4% in 2019-21. The World Bank's own multidimensional metric pegged the rate at 15.5% in 2022-23.
| Poverty Metric & Benchmark | Baseline Level | Latest Official Level | Target Year / Projection |
|---|---|---|---|
| Extreme Poverty Line ($3.00/day, 2021 PPP) | 27.1% (2011) | 2.6% (2023) | ~2.0% (2024) |
| Lower Middle-Income Line ($4.20/day, 2021 PPP) | 57.7% (2011) | 16.1% (2023) | 12.1% (2028) |
| Population Lifted Above $4.20/day Threshold | — | 496 Million | Cumulative (2011–2023) |
| OPHI Multidimensional Poverty Index (MPI) | 53.8% (2005-06) | 16.4% (2019-21) | — |
| World Bank Multidimensional Poverty Measure | — |
Deprivation did not vanish evenly across society. Instead, it concentrated.
The World Bank documented that remaining poverty now clusters heavily among households marked by low schooling, minimal physical assets, limited access to stable wage contracts, and high dependency ratios.
As poverty declined, it became increasingly concentrated among households with lower education, fewer assets, limited access to stable employment, and higher dependency ratios. Wage disparities, however, remain pronounced, as median earnings among the top 10 per cent of workers were about 13 times those of the bottom 10 per cent in 2023.
World Bank Report
Income distribution remains lopsided. Top earners continue to pull away from the base, leaving informal laborers exposed to seasonal shocks.
What drove the collapse in headline numbers? The World Bank identified three engines: sustained private consumption growth, a surge in female labor market participation, and large-scale state welfare transfers.
Direct cash distributions through Direct Benefit Transfer (DBT) pipelines bypassed administrative leakages. Simultaneously, the central government's Pradhan Mantri Garib Kalyan Anna Yojana (PM-GKAY) secured free foodgrain allocations for millions of families, freeing up household cash for non-food expenses.
Domestic measures track a similar trajectory. In 2011-12, the Rangarajan Committee established baseline nutritional and non-food consumption thresholds tailored independently for villages and cities.
"India's domestic approach to measuring poverty has traditionally used consumption thresholds consistent with minimum nutritional requirements and expenditure on specified non-food items," stated DK Srivastava, Chief Policy Advisor at EY India. "In 2011-12, the Rangarajan Committee re-estimated these poverty thresholds, with separate poverty lines for rural and urban areas and variations across states. These thresholds were substantially higher than the international extreme poverty line."
A Reserve Bank of India study covering 19 states applied updated Rangarajan thresholds to the 2022-23 fiscal year. On a population-weighted basis, rural poverty across those states dropped from 31.1% to 6.7%. Urban poverty fell from 26.9% to 6.8%.
Srivastava pointed to the dual role of the national rural employment guarantee scheme—previously known as MGNREGA and designated as VB-G-RAM-G—and state-level cash subsidies in establishing an income floor for rural laborers.
The battle against deprivation now shifts toward sustaining momentum at higher income bars. The World Bank projects that the proportion of citizens living below the $4.20-a-day benchmark will drop from 14.2% in 2026 to 12.1% by 2028, setting the timeline for India's transition into higher-middle-income living standards.
| 15.5% (2022-23) |
| — |
| RBI 19-State Study: Rural Poverty Headcount | 31.1% (2011-12) | 6.7% (2022-23) | Population-weighted |
| RBI 19-State Study: Urban Poverty Headcount | 26.9% (2011-12) | 6.8% (2022-23) | Population-weighted |