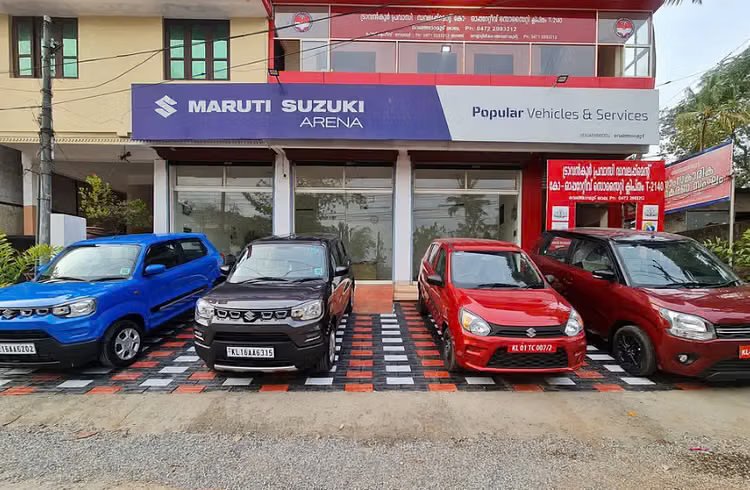
Automobile dealership operations run on razor-thin margins and rapid inventory turnaround. For car buyers negotiating delivery timelines on showroom floors, dealer balance sheets dictate vehicle pipeline health and stock availability. Popular Vehicles proved that volume throughput can overturn red ink, swinging back into the black during the second quarter of the financial year.
The automotive dealership major posted a consolidated net profit attributable to owners of ₹2.20 crore for Q2 FY27. That represents a decisive turnaround from the ₹0.57 crore net loss booked during the corresponding quarter of the previous financial year. Momentum accelerated behind showroom counters. Quarter-on-quarter, bottom-line earnings jumped 61.3 percent from the ₹1.37 crore clocked in Q1 FY27.
Consolidated revenue from operations expanded 36 percent year-on-year to touch ₹2,088.92 crore between July and September, up from ₹1,535.65 crore in Q2 FY26. Sequentially, operational intake grew 10.2 percent from the ₹1,894.97 crore recorded in the opening quarter of FY27. Total income reached ₹2,093.76 crore, supported by ₹0.48 crore in other income.
Yet moving metal off showroom floors came with an aggressive bill.
Total consolidated expenses climbed 35.4 percent year-on-year to ₹2,089.48 crore, compared to ₹1,543.45 crore during the same stretch last year. The operational load stemmed almost entirely from inventory purchases. Outlays for stock-in-trade stood at ₹2,026.60 crore for the quarter—underscoring the massive working capital required to line showroom floors with fresh passenger cars, two-wheelers, and commercial vehicles. On a sequential basis, total expenses expanded 9.6 percent from ₹1,906.63 crore in Q1 FY27.
| Consolidated Financial Metric | Q2 FY27 | Q1 FY27 (QoQ) | Q2 FY26 (YoY) |
|---|---|---|---|
| Revenue from Operations | ₹2,088.92 cr | ₹1,894.97 cr (+10.2%) | ₹1,535.65 cr (+36.0%) |
| Total Income | ₹2,093.76 cr | — | — |
| Total Expenses | ₹2,089.48 cr | ₹1,906.63 cr (+9.6%) | ₹1,543.45 cr (+35.4%) |
| Stock-in-Trade Purchases | ₹2,026.60 cr | — | — |
| Net Profit / (Loss) to Owners | ₹2.20 cr | ₹1.37 cr (+61.3%) |
While consolidated operations benefited from ancillary dealership arms and service streams, the standalone core business worked through heavy operating commitments. The standalone unit recorded a net loss of ₹0.52 crore for the second quarter.
Losses narrowed.
The standalone shortfall shrank from a ₹0.70 crore loss in Q2 FY26. Sequentially, the deficit narrowed 21 percent compared to the ₹0.66 crore loss registered in Q1 FY27. Standalone revenue from operations leaped 46.3 percent year-on-year to ₹1,042.46 crore, compared to ₹712.61 crore a year ago, while advancing 12.4 percent sequentially from ₹927.08 crore.
| Standalone Financial Metric | Q2 FY27 | Q1 FY27 (QoQ) | Q2 FY26 (YoY) |
|---|---|---|---|
| Standalone Revenue from Operations | ₹1,042.46 cr | ₹927.08 cr (+12.4%) | ₹712.61 cr (+46.3%) |
| Standalone Expenses | ₹1,058.07 cr | ₹946.55 cr (+11.8%) | ₹727.69 cr (+45.4%) |
| Standalone Net Loss | (₹0.52 cr) | (₹0.66 cr) (-21.0%) | (₹0.70 cr) (Narrowed) |
Standalone expenses kept pace with the showroom blitz, rising 45.4 percent year-on-year to ₹1,058.07 crore from ₹727.69 crore. Sequentially, costs mounted 11.8 percent from ₹946.55 crore in the prior quarter.
Market Context: Dealership networks face escalating carrying costs as original equipment manufacturers push inventory into distribution pipelines ahead of critical buying cycles. With stock purchases absorbing over 96 percent of consolidated operational revenues, managing working capital cycles and inventory holding periods remains paramount for dealership survival.
For auto buyers and fleet operators tracking vehicle availability, the heavy capital commitment in stock-in-trade points to ready forecourts across regional outlets as dealership networks focus on clearing stock into the second half of the fiscal year.
| (₹0.57 cr) (Turnaround) |