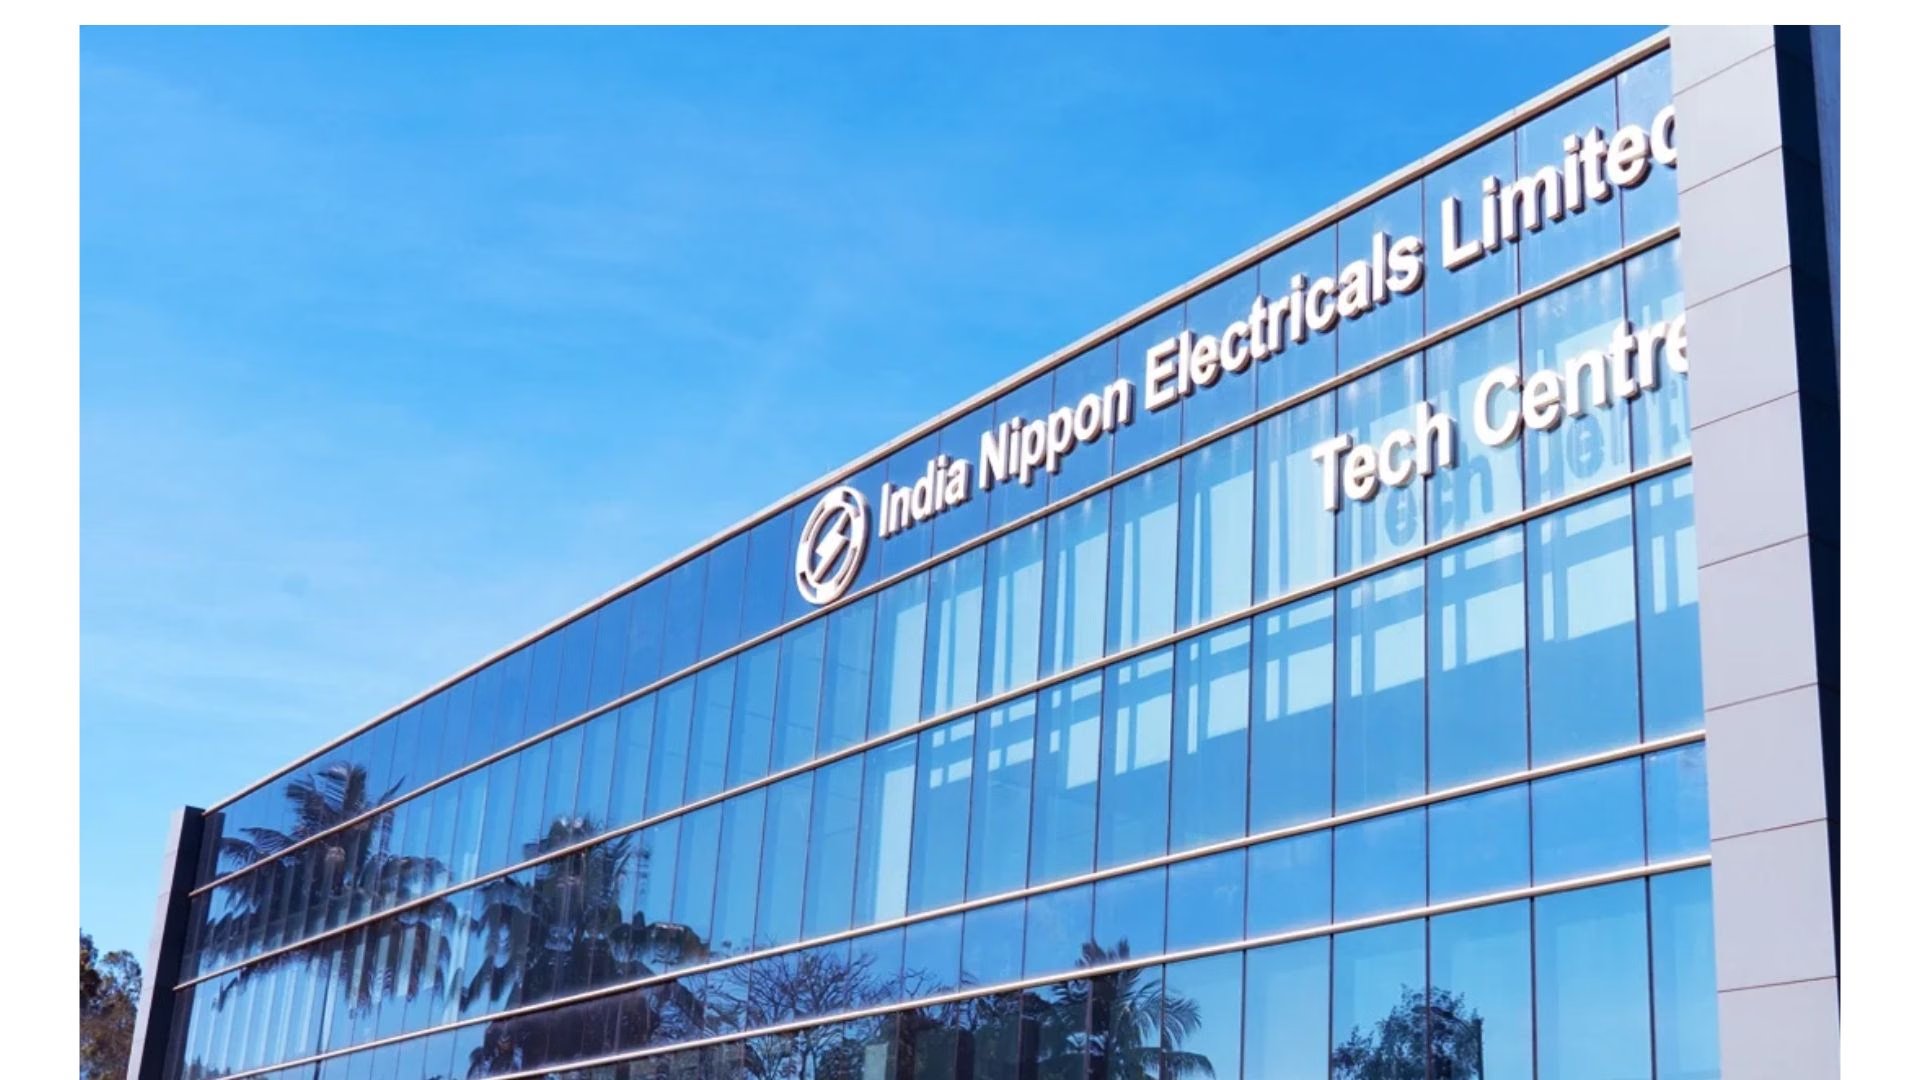
Automotive electronic supplier India Nippon Electricals Ltd clocked a 27.5% year-on-year surge in revenue from operations to ₹347.48 crore for the second quarter ended September 30, 2026.
But higher production bills took a bite out of the bottom line. Net profit dropped 6% to ₹21.81 crore, down from ₹23.20 crore during the same quarter last year. A runaway raw material bill expanded 32.1% to ₹250.51 crore—outpacing top-line expansion and swallowing 72.1% of operational turnover. The margin squeeze filtered straight through to operating lines, dragging profit before tax down 11.1% to ₹28.53 crore from ₹32.08 crore. Basic earnings per share retreated to ₹9.64 from ₹10.26.
Performance swung just as sharply on a sequential basis. Quarter-on-quarter, top-line sales climbed 14.1% from ₹304.48 crore logged in the June quarter. Yet net earnings tumbled 19.3% from the ₹27.03 crore recorded in Q1, hammered by a sudden collapse in ancillary income and stubborn input spikes.
Cost inflation dominated the quarter's ledger. The aggregate material bill—spanning raw supplies, stock purchases, and inventory shifts—rose 17.7% sequentially from ₹212.88 crore. In the year-ago period, material charges claimed 69.6% of turnover, while Q1 pegged that figure at 69.9%. That upward drift to 72.1% restricted revenue less material costs to ₹96.97 crore, or 27.9% of top-line revenue, down from 30.4% twelve months prior.
Total expenditure climbed 29.3% to ₹319.82 crore. Material costs alone accounted for ₹60.84 crore—an overwhelming 84% of the ₹72.44 crore net increase in overall corporate spending. While revenue still surpassed total outgoings by ₹27.66 crore, that cushion narrowed to 8.0% of turnover against 9.2% last year.
Other income dried up almost entirely. The line item brought in just ₹87 lakh, down from ₹6.90 crore in the year-ago quarter and ₹8.10 crore in the preceding three months. A 24.3% drop in tax liabilities to ₹6.72 crore kept the net profit slip from deteriorating further.
| Financial Metric | Q2 FY2027 | Q2 FY2026 | YoY Change (%) | Q1 FY2027 | QoQ Change (%) |
|---|---|---|---|---|---|
| Revenue from Operations | ₹347.48 cr | ₹272.53 cr | +27.5% | ₹304.48 cr | +14.1% |
| Total Expenses | ₹319.82 cr | ₹247.38 cr | +29.3% | — | — |
| Material Costs |
*Comparative balance sheet figures reflect balances as of March 31, 2026.
Balance sheet metrics point to lean operational borrowing and active capital deployment. Outside of lease contracts, the company holds zero institutional borrowings. Cash and cash equivalents trimmed down to ₹3.27 crore on September 30, against ₹5.50 crore at the close of March 2026. Working capital trends showed inventories expanding 25.5% to ₹114.05 crore, while trade receivables edged up 11.8% to ₹230.81 crore. Concurrently, supplier dues dropped, with trade payables falling 24.2% to ₹146.73 crore from ₹193.61 crore at the end of the previous fiscal year.
Combined current and non-current financial investments stood at ₹552.89 crore, up from ₹531.53 crore in March. During the first half of the fiscal year, purchases of investments stood at ₹686.52 crore alongside sales of ₹668.34 crore. Capital outlays—including projects in progress—totaled ₹23.23 crore across the six months, running well ahead of the period's ₹10.66 crore depreciation charge. Capital work-in-progress climbed to ₹17.07 crore from ₹6.82 crore in March, though company filings did not designate individual plant destinations for the fresh outlay.
Market Context: Component suppliers feeding two- and three-wheeler manufacturers are facing clear margin headwinds. Demand remains solid, but steep swings in electronic assemblies and metals continue to test unit economics across auto-ancillary assembly lines.
Across the broader six-month horizon, the company maintained steady top-line traction. First-half revenue climbed 31.1% to ₹651.96 crore, while net earnings rose 5.0% to ₹48.84 crore. The business operates entirely within a single unified segment, engineering electrical and electronic units for two-wheelers, three-wheelers, and internal combustion engines. It runs with no corporate subsidiaries, following the formal dissolution of PT Automotive Systems Indonesia Ltd on June 25, 2025.
| ₹250.51 cr |
| ₹189.67 cr |
| +32.1% |
| ₹212.88 cr |
| +17.7% |
| Other Income | ₹0.87 cr | ₹6.90 cr | -87.4% | ₹8.10 cr | -89.3% |
| Profit Before Tax | ₹28.53 cr | ₹32.08 cr | -11.1% | — | — |
| Net Profit | ₹21.81 cr | ₹23.20 cr | -6.0% | ₹27.03 cr | -19.3% |
| Basic EPS | ₹9.64 | ₹10.26 | -6.0% | — | — |
| Inventories | ₹114.05 cr | ₹90.91 cr* | +25.5% | — | — |
| Trade Receivables | ₹230.81 cr | ₹206.46 cr* | +11.8% | — | — |
| Trade Payables | ₹146.73 cr | ₹193.61 cr* | -24.2% | — | — |